Tutorials
Under construction(1) Getting started
(2) Namelists
(3) Verification
(4) Input data
(5) New schemes
Verification
COMPS has the ability to verify the forecasts that it makes. The OutputVerif scheme stores verification
statistics in special NetCDF files. Each time COMPS is run, new verification information is appended to the file.
To enable verification, make sure the outputs attribute in your run has the scheme
verif (for example outputs=netcdf,verif). If this is done, the
verification files will show up in results/<runName>/verif/. There is one file
for each configuration.
The metrics=... attribute in variable/configuration specified which verification
metrics are computed. For most verification purposes it is enough to have
metrics=obs,fcst,mae,pit.
Verification is done by invoking the verif located in graphics/ on the
files in results/<runName>/verif/. It is used as follows (assumes that the
graphics/ folder is added to your path):
verif <files> -m <metric><files> are one or more NetCDF verification files and <metric> is one
of the many verification metrics available (see the examples page for a
list)
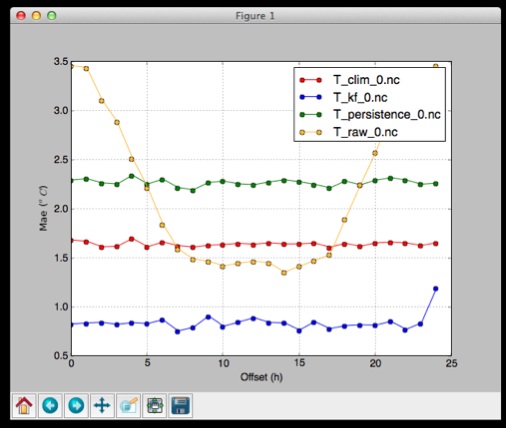
Running verif will open a window showing a graph with verification results, as shown on
the right.
Command-line options
Saving as file
Use the -f <filename> option. File extensions emf, eps, pdf, png, ps, raw, rgba,
svg, and svgz are supported.
Use -fs <width><height> to specify the size of the exported image (in
inches).
Anomaly statistics
Verification is often used to show improvements against some baseline. The baseline is often chosen to be the best forecast you can make without using a weather model. Typically this is a climatology or persistence forecast.
When you check the ability of your system to forecast a certain event, you often get good scores because for the most part the threshold for the event is way above or below the current weather. We are therefore more intersted in determining how the system is able to forecast anomalies. A climatology forecast has no ability to forecast anomalies.
You can use -c <file> to compute anomalies. <file> is any COMPS
verification NetCDF file.
Note that anomaly statistics is most useful for variables, such as temperature, that have strong seasonal, diurnal, or spatial variability.
Subsetting
By default, scores are computed for all stations, offsets, and dates available. When multiple files are used, only those locations, offsets, and dates that all files have are used.
However,
| Option | Description |
|---|---|
-l <locations> |
Only compute scores for these location indices. E.g. -l 0:5 |
-o <offsets> |
Only compute scores for these offsets. E.g. -o 0:4,24:28 |
-d <start-date>,<end-date> |
Only compute scores for dates within this range (inclusive). E.g. -o 0:4,24:28 |
Specifying the x-axis
By default, the scores are shown with the forecast horizon (offset) on the x-axis. This means that scores are computed independently for each offset. For many scores, the scores can be computed separately for each date and location and displayed that way.
| Option | Description |
|---|---|
-x offset |
Plot the offset along the x-axis. This is the default. |
-x date |
Plot the date along the x-axis. |
-x threshold |
For metrics with thresholds (e.g. ETS), plot the threshold along the x-axis. |
-x location |
Plot the station in order on the x-axis. |
-x locationId |
Plot the station's id on the x-axis. |
-x locationElev |
Plot the station's elevation on the x-axis. |
-x locationLat |
Plot the station's latitude on the x-axis. |
-x locationLon |
Plot the station's longitude on the x-axis. |